Housing Data

Data Viz History


How, Who, What is behind it?


Data visualization was only recognized as a branch of statistics after a professor named John W Tukey wrote a historical paper called ‘The Future of Data Analysis’. In this paper he called for data visualization to be recognized in the legitimate branch of statistics and not just simply a part of mathematics. After publication of this paper he began to invent a wide variety of new, simple and effective graphic displays, under the name of “Exploratory Data Analysis” (EDA)

These include many diagrams we know today such as - stem-leaf plots, box plots, hanging rootograms, two-way table displays to name a few examples. Many of his graphics have now entered the statistical vocabulary and are included in visualization and statistical software implementation today.

Since the creation of data visualization from mapping out the sun position for ancient burial grounds to the now more advanced methods, John W Tukey was the fire that ignited innovation in this field.

From 1977 to the 21th century it has rapidly increased, helped by through the development of programming languages such as C which was created by Bell labs in 1994.

Software development in large-scale statistical and graphics software engineering projects in the private sector such as SAS and open source developments such as the R project have led to rapidly increased innovation, technology and computing power. As a result, interest in data visualization has grown, as have the number of applications being created in the field.


John W Turkey


John Turkey


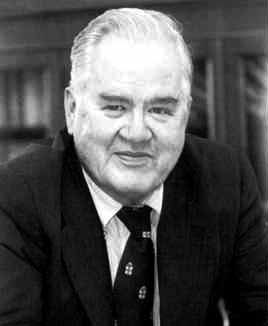
John Wilder Tukey (June 16, 1915 – July 26, 2000) was an American mathematician best known for development of the Fast Fourier Transform (FFT) algorithm and box plot.


He was awarded the National Medal of Science by President Nixon in 1973. He was awarded the IEEE Medal of Honor in 1982 "For his contributions to the spectral analysis of random processes and the fast Fourier transform (FFT) algorithm".


History behind data visualization


About me, Final year Student, IADT


Bryan Agar


Bryan Agar


Final year student in IADT, Dublin

BSc in Studying Creative media technolgies


Intrested in all things

  • Technololgy
  • Video
  • Programming
  • Data analytics


Scroll Indicator